Case Studies
Putting your FCA into action
- Challenge:
- A 5M GSF health campus in South Florida had challenges converting their FCA-defined deferred maintenance need into executable projects. Leadership supported the findings of the FCA through additional funding, but facility management and project delivery teams struggled to define actionable steps to address the need.
- Halcyon’s Impact:
- Halcyon deployed the Renewal Asset Management Program to convert need into projects. In a cradle-to-grave approach, Halcyon evaluated the performance of mechanical, electrical and plumbing systems, developed projects based on the deficiencies identified, and managed the execution of all funded work.
- Outcome:
- In one building, the FCA stated there was $46M in deferred maintenance. Halcyon determined $6.3M of reinvestment would resolve deficiencies in 34 assets and various distribution systems.
| Ramp Inventory | RAMP Stabilization Status | RAMP Reinvestment Recommendations | ||||||||
|---|---|---|---|---|---|---|---|---|---|---|
| System | Asset | Count | Unstable Assets | % Unstable | FCA Deferred Maintenance | RAMP Project Cost | RAMP Funding Recommendation | Comments | ||
| Mechanical | AHUs, Ductwork & Distribution | 12 | 9 | 75% | $ 20,820,224 | $ 4,510,300 | Fund | Refurbish (10) AHUs, resolve downstream distribution & reseal ductwork | ||
| Boilers | 2 | 0 | 0% | $ 435,128 | $ – | Do Not Fund | Boilers stable; no recommendations | |||
| Heat Exchangers | 3 | 0 | 0% | $ – | $ – | Do Not Fund | Heat exchangers stable; no recommendations | |||
| CHW Pumps | 5 | 1 | 20% | $ 187,275 | $ 15,000 | Fund | Replace CHWP 1 | |||
| HHW Pumps | 4 | 1 | 25% | $ 111,099 | $ 40,000 | Fund | Replace HHWP 5 | |||
| Exhaust Fans | 25 | 0 | 0% | $ 807,112 | $ 10,000 | Fund | Install roof guardrail; Exhaust fans operational; no recommendations | |||
| Fume Hoods | 4 | 0 | 0% | $ – | $ 57,000 | Fund | Repair fume hoods | |||
| Controls | N/A | N/A | N/A | $ 3,548,782 | $ 490,000 | Fund | Upgrade controls (new front end & tie in critical assets; provide graphics) | |||
| Plumbing | DCW Pumps | 2 | 1 | 50% | $ 102,450 | $ 20,000 | Fund | Replace DCWP 1 | ||
| Sewer/Sump Pumps | 5 | 0 | 0% | $ 165,753 | $ – | Do Not Fund | Pumps stable; no recommendation | |||
| Water Heater | 1 | 0 | 0% | $ 12,473 | $ – | Do Not Fund | Water heater stable; no recommendation | |||
| Air Compressor | 6 | 6 | 100% | $ 112,384 | $ 60,000 | Fund | Install rotary air compressors and dryer for control air | |||
| Expansion Tank | 6 | 0 | 0% | $ 22,567 | $ – | Do Not Fund | Expansion tanks stable; no recommendation | |||
| Plumbing Fixtures (Sinks/Showers/Toilets) | N/A | N/A | N/A | $ 2,729,617 | $ – | Do Not Fund | Defer until future renovations | |||
| Distribution | N/A | N/A | N/A | $ 4,323,182 | $ 327,000 | Fund | Resolve findings from pipe scan assessments | |||
| Electrical | Switchgear | 2 | 0 | 0% | $ – | $ 46,500 | Fund | Equipment operating; maintenance overdue & requires electrical shutdowns | ||
| Main Transformers | 1 | 0 | 0% | $ – | $ 49,500 | Fund | Equipment operating; maintenance overdue & requires electrical shutdowns | |||
| Transfer Switches | 9 | 4 | 44% | $ 154,620 | $ 102,000 | Fund | Replace (2) transfer switches | |||
| Bus Ducts | 3 | 0 | 0% | $ 2,043,361 | $ – | Do Not Fund | Bus ducts stable; no recommendations | |||
| Motor Control Center | 2 | 1 | 50% | $ 495,086 | $ 220,000 | Fund | Decommission MCC & replace with main distribution panel | |||
| Transformers/Panels/Breakers | 100 | 0 | 0% | $ 2,373,949 | $ 350,000 | Fund | Recent IR scan deficiencies to be resolved with replacement of OR electrical panels | |||
| Emergency Lighting | N/A | N/A | N/A | $ 786,898 | $ – | Do Not Fund | Defer until future renovations | |||
| Lighting | N/A | N/A | N/A | $ 5,276,521 | $ – | Do Not Fund | Defer until future renovations | |||
| Wiring | N/A | N/A | N/A | $ 2,175,906 | $ – | Do Not Fund | Defer until future renovations | |||
| 192 | 23 | 12% | $ 46,684,386 | $ 6,297,300 | ||||||
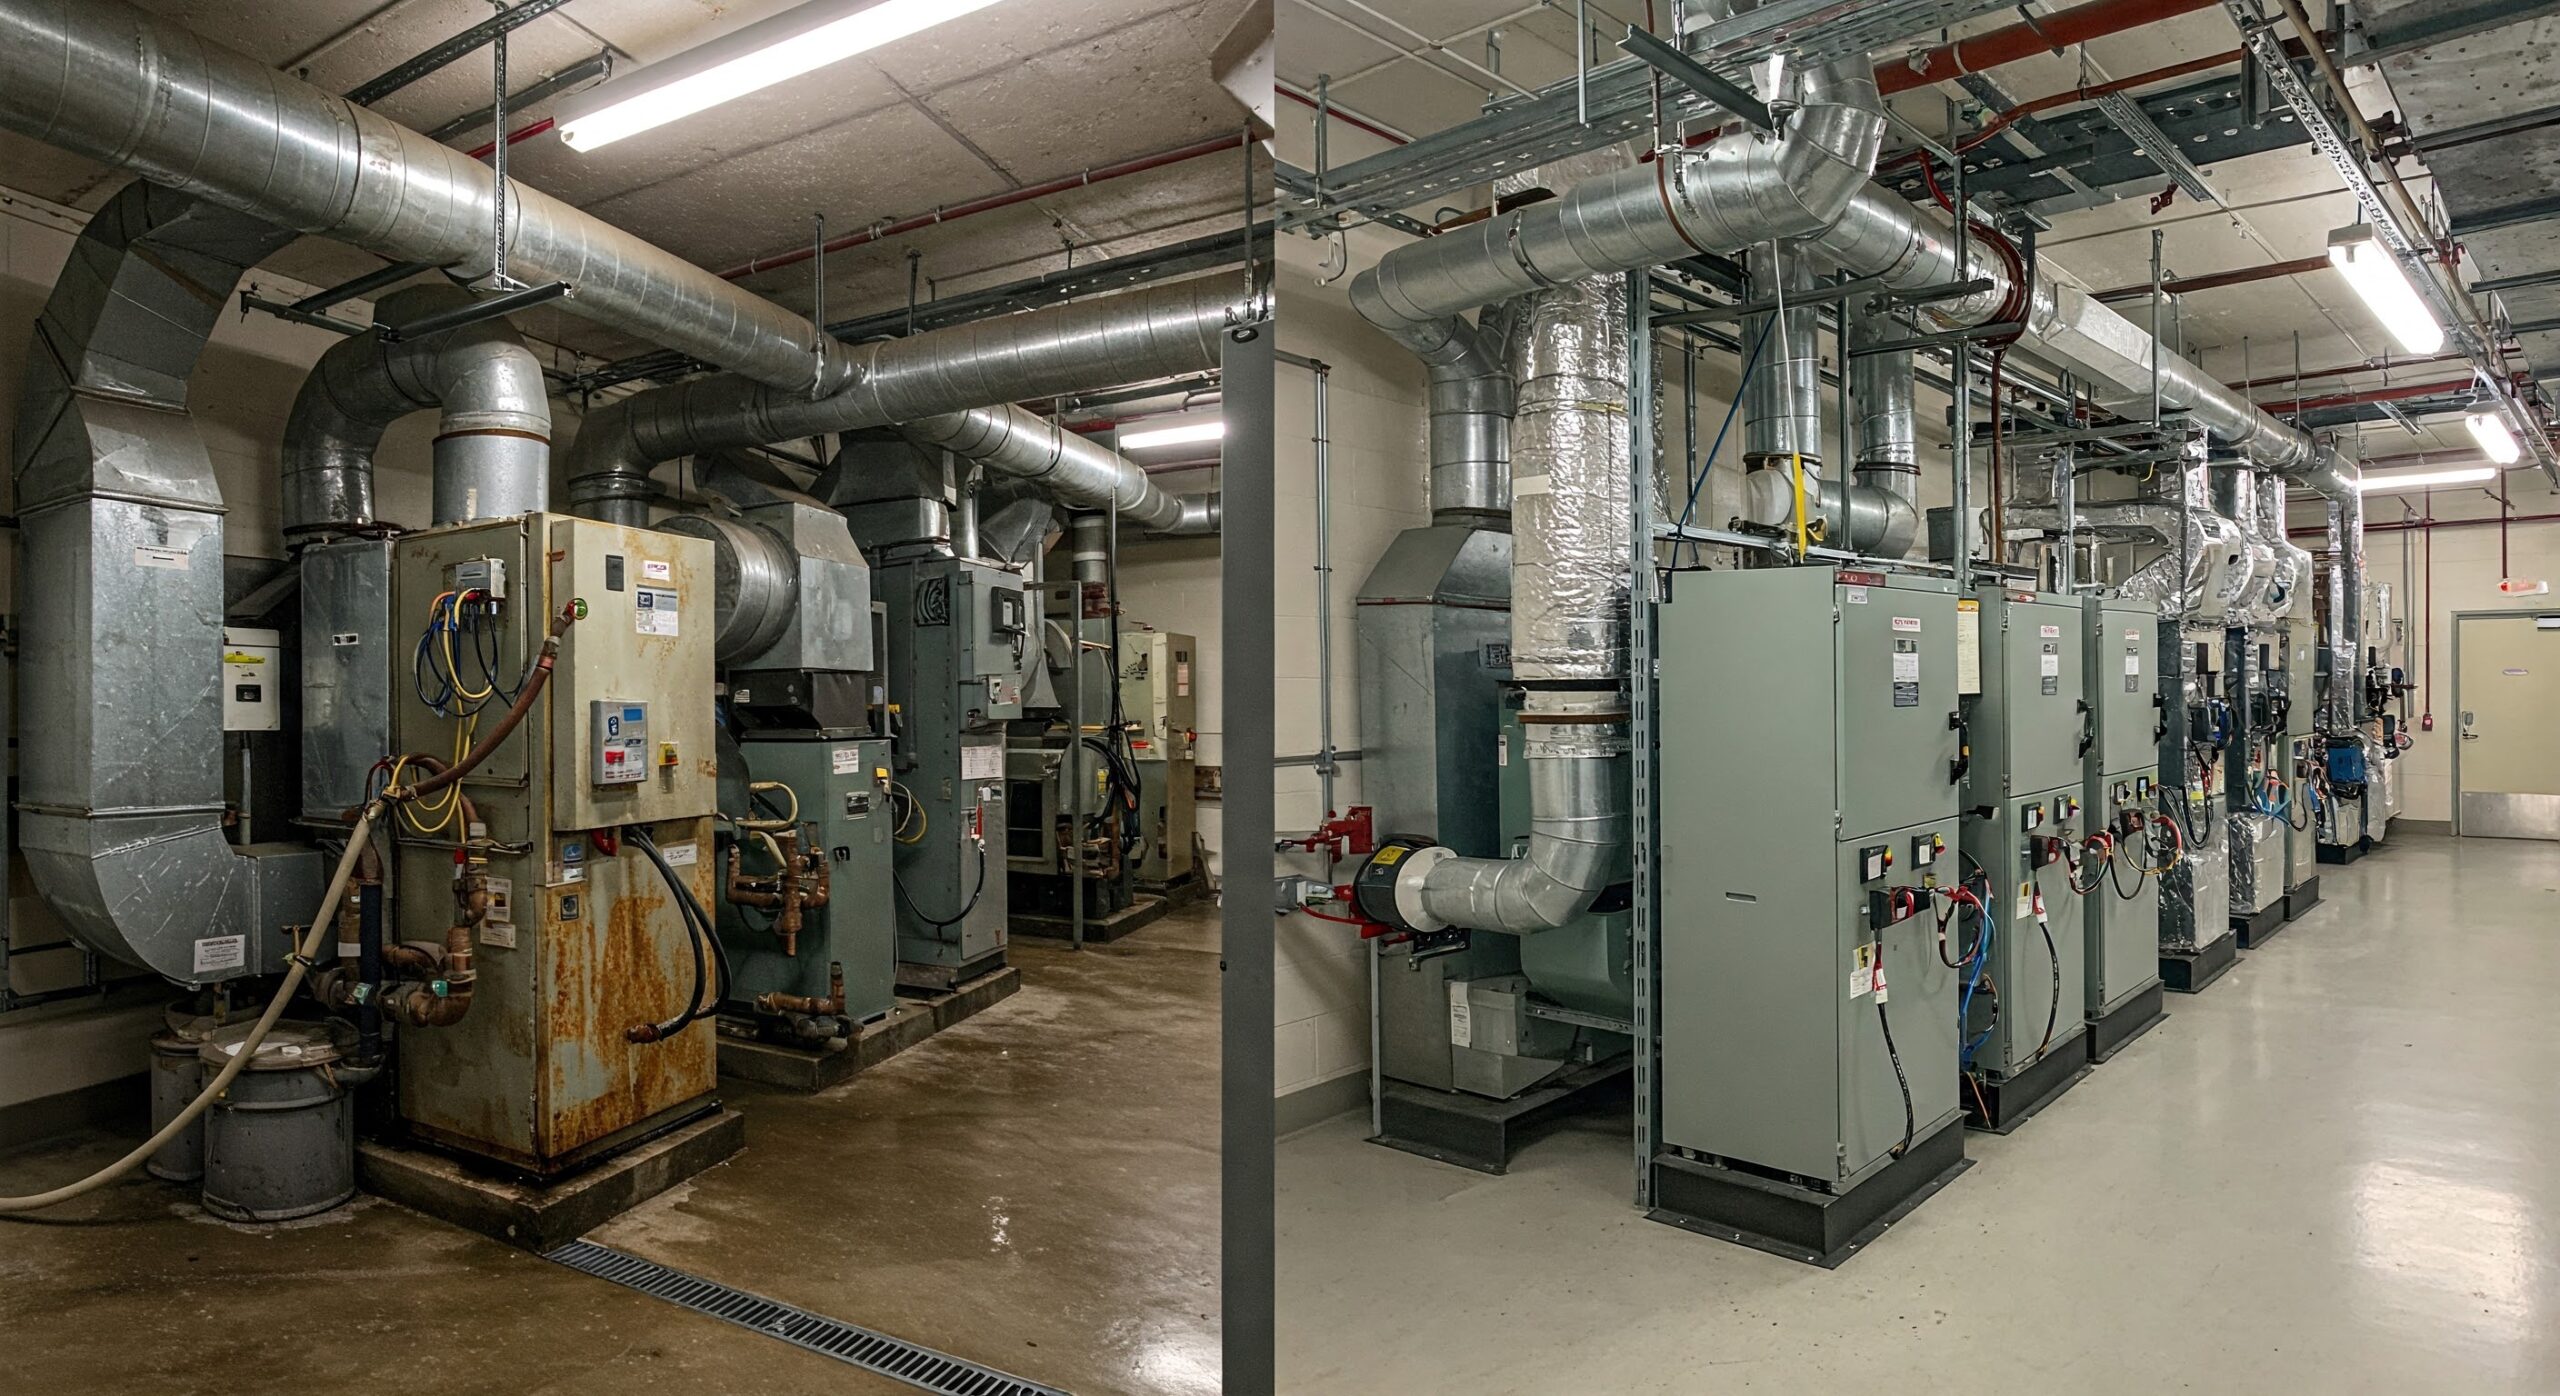
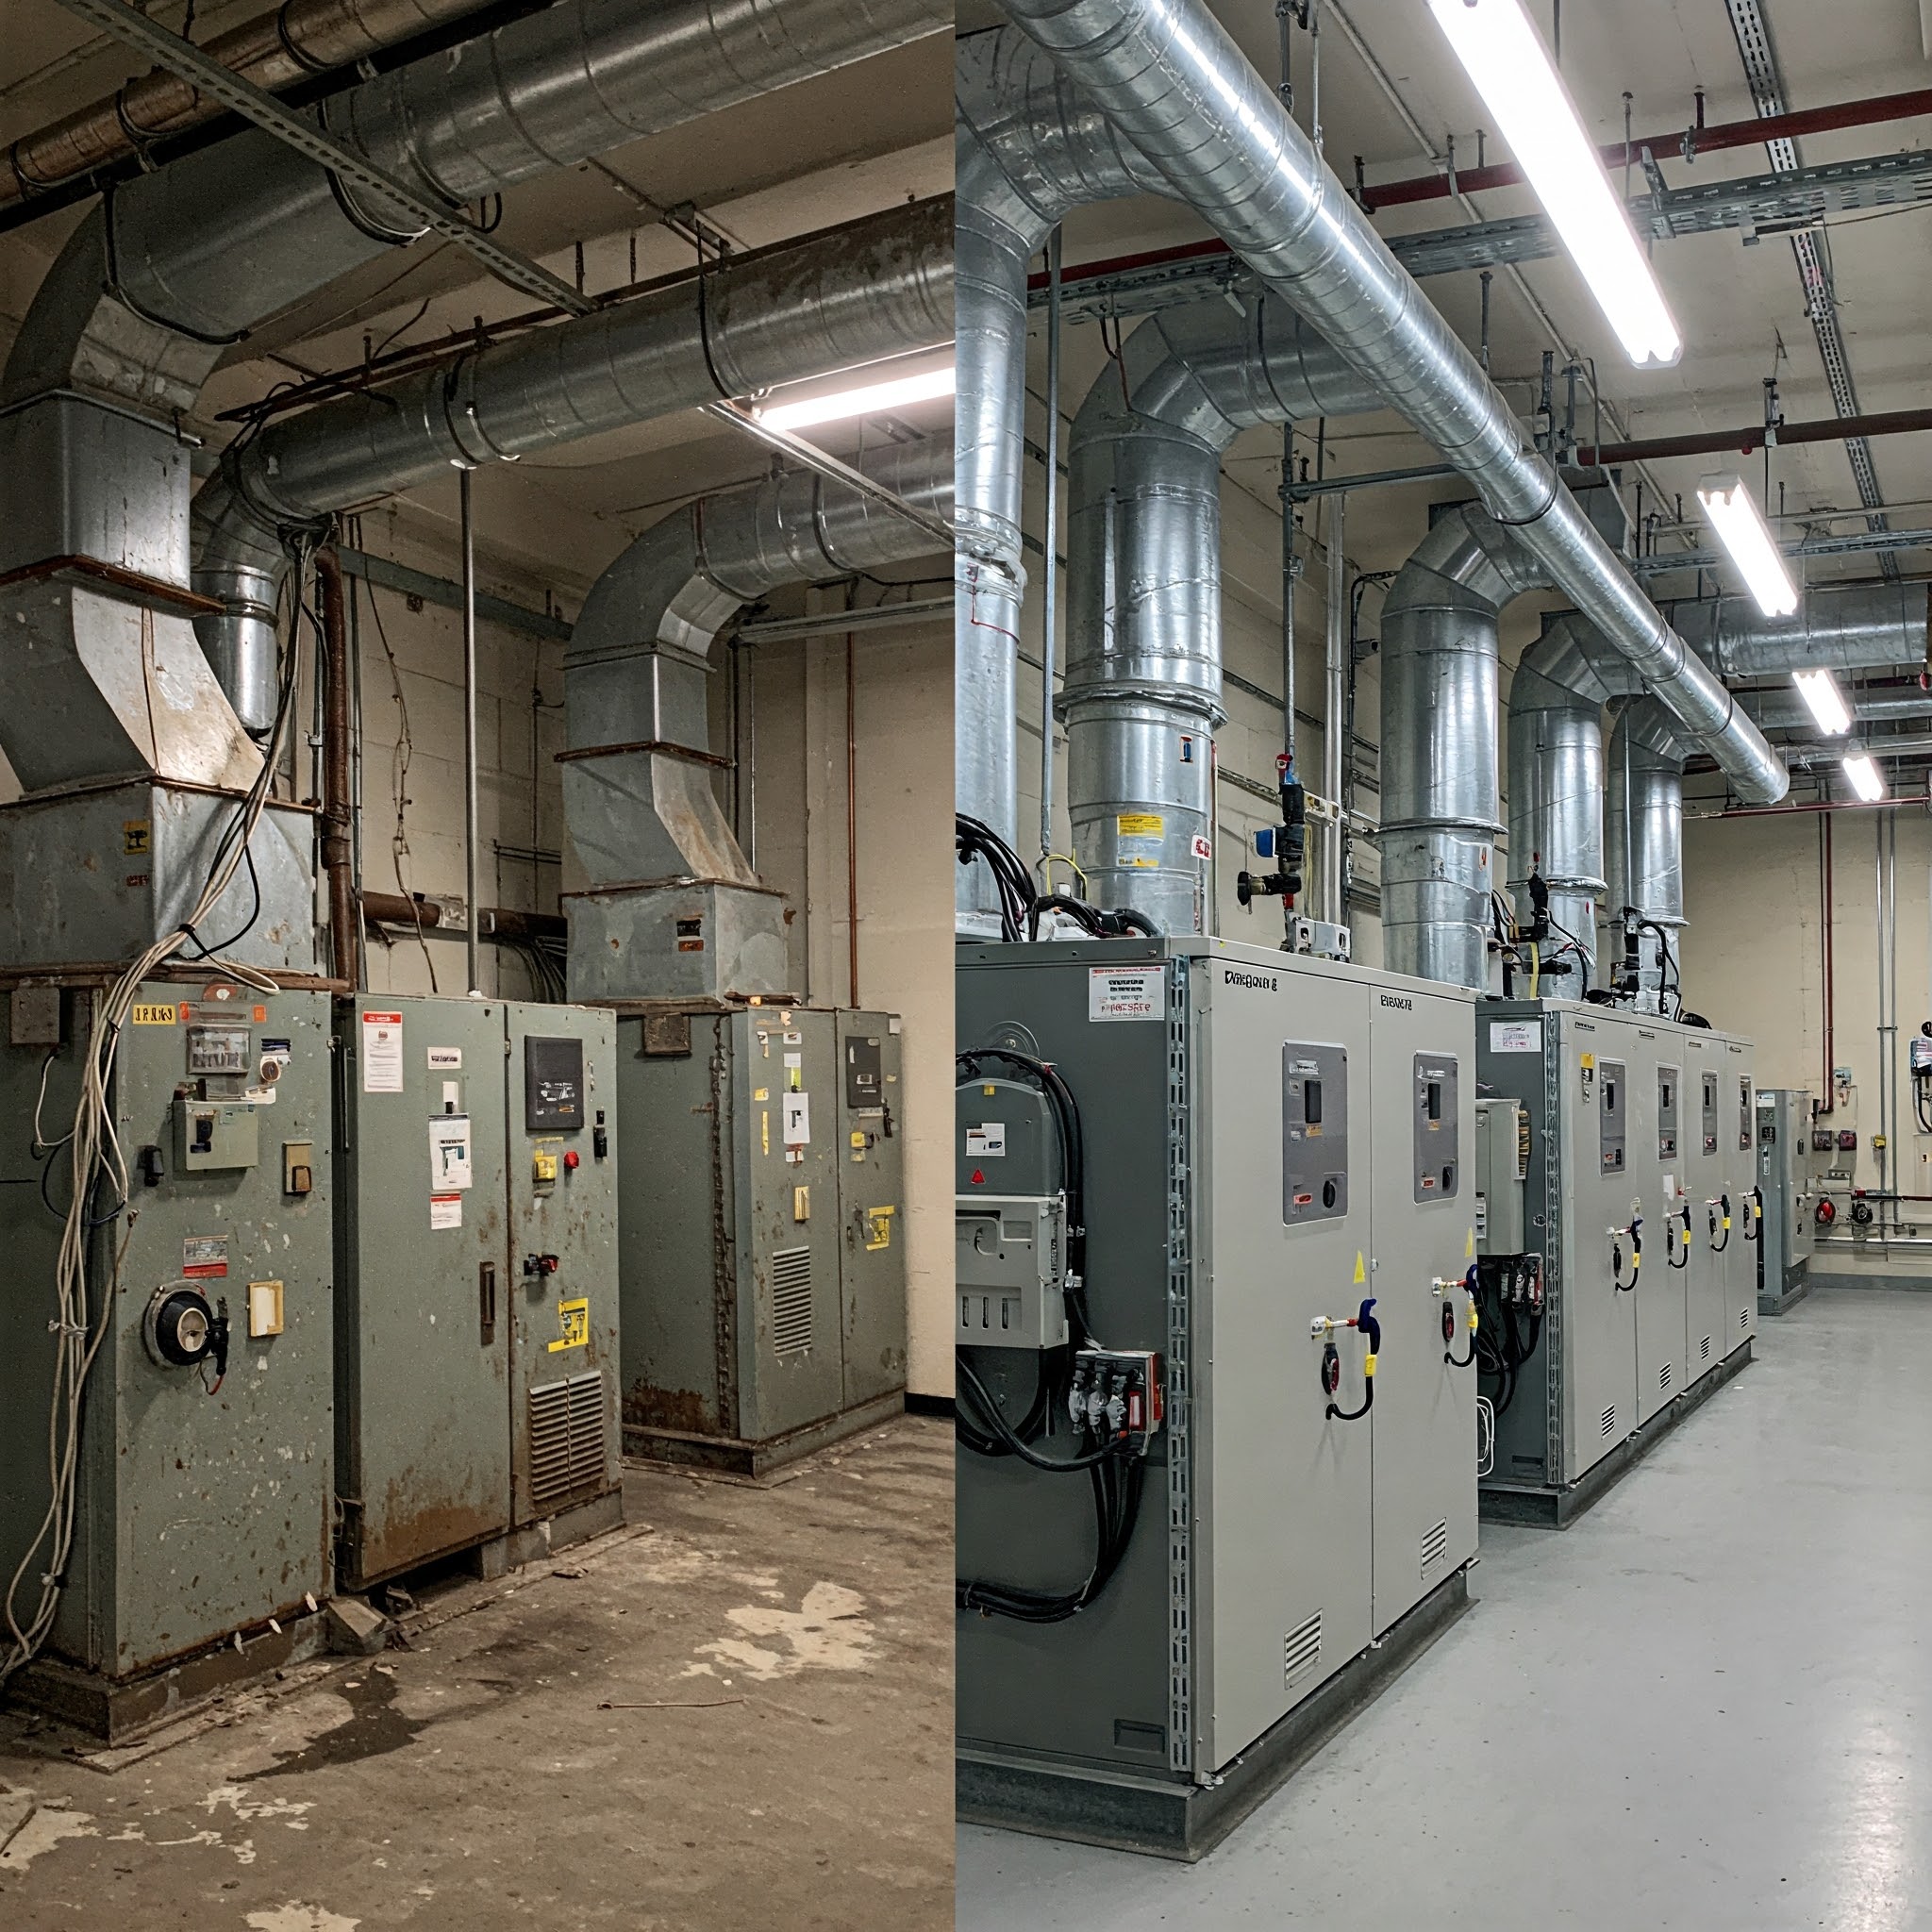
Improve reliability and ROI by integrating refurbishment projects into your deferred maintenance strategy
- Challenge:
- A recent FCA for a hospital indicated all air handling units were deferred and in need of replacement for $2.9M. Facility leaders prioritized the replacement of 5 critical units serving 10 operating rooms, the emergency department and the east and west wings of the hospital. After a lengthy design, cost estimates for the replacement projects escalated to $10.5M and would require extensive disruption to a 24/7 facility.
- Halcyon’s Impact:
- Halcyon’s assessments determined that while these units were underperforming, they met the capacity requirements for the building. It was recommended to refurbish the units at a fraction of the cost, time, and disruption to replace them.
- Outcome:
- For 36% of the replacement cost for 5 AHUs, Halcyon was able to refurbish 10 AHUs. Beyond the cost avoidance, all AHUs were refurbished in less than 12 months, compared to the multi-year commitment needed to design, procure, and construct new units.
| Project Comparisons | FCA Defined Need | Replacement Project | Renewal Project | |
|---|---|---|---|---|
| Scope | Replace 10 AHUs | Replace 5 AHUs New units, no change in capacity | Refurbish 10 AHUs Achieve original design performance | |
| Cost | Project Budget | $2.9M | $10.5M | $3.8M |
| $/Asset | $0.29M | $2.1M | $0.38M | |
| % Annual Funding | 5.0% | 17% | 6.3% | |
| Schedule | Duration (months) | N/A | 36 | 12 |
| Design | 12 | 3 | ||
| Procurement | 12 | 7 | ||
| Construction | 12 | 2 | ||
| Disruption | Long outages requiring temporary AHUs | Short outages only requiring spot coolers | ||
Advance your maintenance staffing profile, reduce reliance on contractors and decrease operating costs
- Challenge:
- A university was faced with a reactive and expensive maintenance portfolio. They could not determine a clear solution without understanding how they compared to peers and what the root causes were to address the problems.
- Halcyon’s Impact:
- Halcyon analyzed and benchmarked in-house and outsourced resources to identify areas of inefficiencies and service issues. The analysis evaluated operating costs, outsourcing reliance, contract management, compensation rates, staff coverage, trades mix, shift coverage, and the preventative maintenance program.
- Outcome:
- An implementation strategy was provided to increase the in-house staff, recruit for specialized positions and eliminate specific contracts and outsourced tasks for an overall cost savings to operations.
| Benchmark Indicator | Metric | Benchmark Status | Current State | Benchmark | Recommended State |
|---|---|---|---|---|---|
| Maintenance Operating Costs | $/GSF | Operating costs are high | $7.72 | $5.30 | $6.66 |
| Reactive Maintenance | % Reactive | High reactive work indicates increased service disruption | 64% | 20% | 30% |
| Outsourcing Reliance | Purchased Services as a % of Total Spend | Most preventative maintenance and repair work is outsourced at premium costs | 83% | 45% | 69% |
| Staff Coverage | GSF/FTE | Maintenance team is understaffed | 94,780 | 76,060 | 67,267 |
| Trades Mix | % Generalists | Majority of trades staff are generalists and cannot respond to technical issues effectively | 69% | 32% | 30% |
| Shift Coverage | % 1st Shift | Lack of off-shift staff leads to an increase in vendor reliance | 90% | 72% | 72% |
| Supervision Ratio | FTE/ Supervisor | Current supervision ratios are adequate | 6.0 | 6.3 | 6.1 |